Wilshire 5000 Stock Index Forecast
Wilshire 5000 Forecast Values
Stock Price Index Values, Average of Month.
| Month | Date | Forecast Value | Avg Error |
|---|---|---|---|
| 0 | Mar 2024 | 51985.74 | ±0.00 |
| 1 | Apr 2024 | 51902 | ±494 |
| 2 | May 2024 | 51257 | ±644 |
| 3 | Jun 2024 | 49480 | ±731 |
| 4 | Jul 2024 | 48080 | ±793 |
| 5 | Aug 2024 | 46100 | ±842 |
| 6 | Sep 2024 | 44760 | ±881 |
| 7 | Oct 2024 | 45150 | ±914 |
| 8 | Nov 2024 | 45510 | ±943 |
Get the Rest of the Story with the 5 Year Forecast!
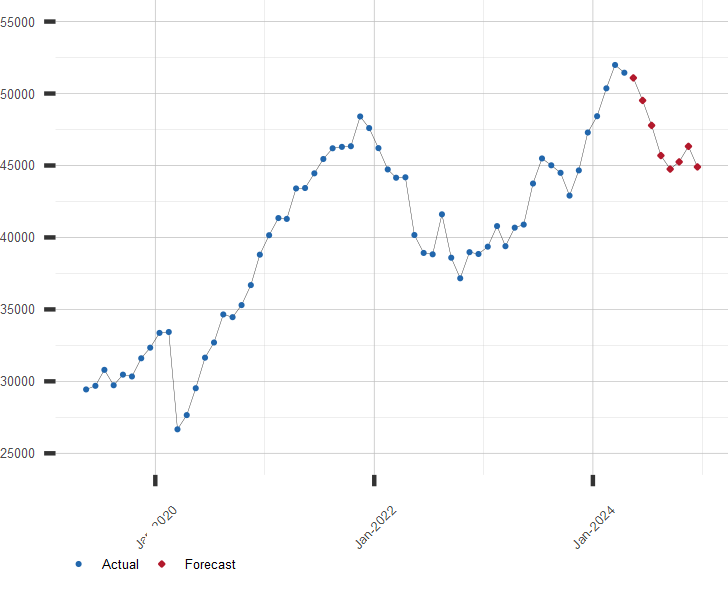
Chart of Wilshire 5000 with Forecast
Stock Price Index Values, Average of Month.
Other Wilshire 5000 and Stock Market Resources:
A long range forecast for the Wilshire 5000 and similar financial series is available by subscription. Click here to subscribe now!
| April 22, 2024 | ||
| Stock Market | Value | Change |
|---|---|---|
| U.S. S&P 500 | 5,010.60 | 0.87% |
| Japan Nikkei 225 | 37,438.61 | 1.00% |
| Hong Kong Hang Seng | 16,511.69 | 1.77% |
| UK FTSE 100 | 8,023.87 | 1.62% |
| German DAX | 17,860.80 | 0.70% |
| Brazil Bovespa | 125,573.16 | 0.36% |