U.S. Personal Income Forecast
U.S. Personal Income Forecast Values
Billion US Dollars. Annual Rate, Seasonally Adjusted.
| Month | Date | Forecast Value | Avg Error |
|---|---|---|---|
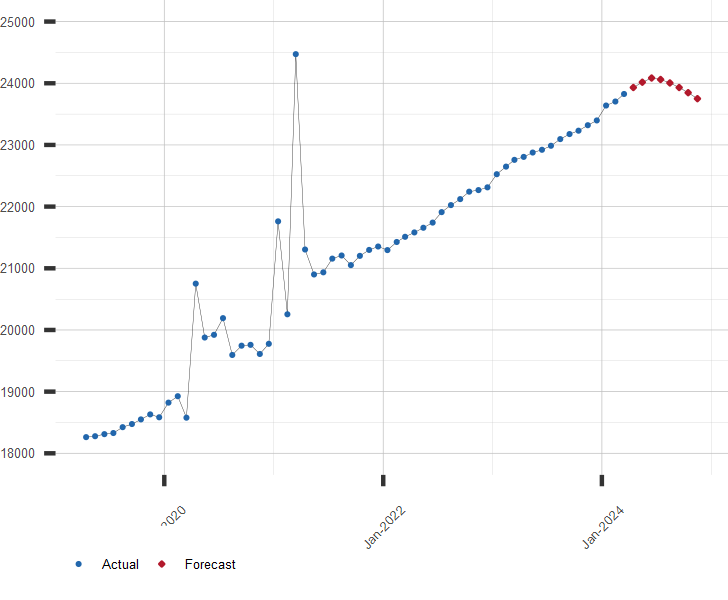
| 0 | Mar 2024 | 23826.0 | ±0.0 |
| 1 | Apr 2024 | 23931 | ±34 |
| 2 | May 2024 | 24017 | ±39 |
| 3 | Jun 2024 | 24085 | ±42 |
| 4 | Jul 2024 | 24061 | ±44 |
| 5 | Aug 2024 | 24005 | ±46 |
| 6 | Sep 2024 | 23931 | ±47 |
| 7 | Oct 2024 | 23847 | ±48 |
| 8 | Nov 2024 | 23750 | ±49 |
Get the Rest of the Story with the 5 Year Forecast!
Chart of Personal Income with Current Forecast
Billion US Dollars. Annual Rate, Seasonally Adjusted.
Other Personal Income Links of Interest:
A long range forecast for Personal Income and similar economic series is available by subscription. Click here to subscribe now!
| May 07, 2024 | |
| Indicator | Value |
|---|---|
| S&P 500 | 5187.70 |
| U.S. GDP Growth, YoY % | 2.97 |
| U.S. Inflation Rate, % | 3.48 |
| Gold Price, $/oz-t | 2314.02 |
| Crude Oil Futures, $/bbl | 78.23 |
| U.S. 10 Year Treasury, % | 4.47 |